Solar PPA microgrid
Outputs below are real: the notebook runs against the
energypack's benchmark model, which CFDL validates against an independent reference. To run it yourself, see the Python SDK guide.
A two-minute agent-driven walkthrough: an AI agent executes this notebook cell by cell, every output computing live in the take. Captions carry the narration.

A solar-plus-storage microgrid with a PPA revenue contract, degradation, O&M escalation, ITC/PTC tax attributes and MACRS depreciation, financed with sculpted debt.
This notebook uses one of the benchmark models, which CFDL validates against an independent reference to the penny.
# On Colab, install the SDK and fetch the models this notebook reads.
# Inside a checkout both are already present and this cell does nothing.
import subprocess, sys
from pathlib import Path

REPO = "https://github.com/cfdl-dev/cfdl"


def repo_root() -> Path:
    """The checkout holding benchmarks/ and packs/, cloning it if need be.

    Searching a bounded set of ancestors means a plain `python` run outside a
    checkout fails with an explanation rather than walking to the filesystem
    root. On a hosted runtime there is no checkout to find, so fetch one.
    """
    here = Path.cwd().resolve()
    for candidate in (here, *here.parents):
        if (candidate / "Cargo.toml").exists() and (candidate / "packs").is_dir():
            return candidate

    if "google.colab" not in sys.modules:
        raise RuntimeError(
            f"No CFDL checkout found above {here}. This notebook reads a model "
            f"from benchmarks/ and pack definitions from packs/, so run it "
            f"inside a clone of {REPO}."
        )

    subprocess.run([sys.executable, "-m", "pip", "install", "-q", "cfdl-sdk[viz]"], check=True)

    # Packs and benchmark models track the engine, so take the checkout at the
    # tag matching the wheel pip just resolved. `main` runs ahead of the last
    # release and its packs may use metric ops the released engine rejects.
    import importlib
    from importlib.metadata import PackageNotFoundError, version

    importlib.invalidate_caches()
    try:
        tag = f"v{version('cfdl-sdk')}"
    except PackageNotFoundError:
        tag = None

    clone = ["git", "clone", "--depth", "1", "-q", REPO]
    target = Path("/content/cfdl")
    if not target.exists():
        pinned = tag is not None and not subprocess.run(
            clone + ["--branch", tag, str(target)]
        ).returncode
        if not pinned:
            # A dev or pre-release wheel has no matching tag; main is the best
            # available, and the notebook may fail if the two have diverged.
            print(f"warning: no {tag} tag for this SDK build; falling back to main.")
            subprocess.run(clone + [str(target)], check=True)
    return target


ROOT = repo_root()
PACKS = ROOT / "packs"

import cfdl_sdkCompile
Compile the model directory to IR.
model_dir = ROOT / "benchmarks/energy/solar_ppa_microgrid"
model = cfdl_sdk.compile(model_dir, packs_dir=PACKS)
print("streams:", len(model.ir["streams"]))streams: 9
Run
Run with the benchmark's configuration and apply the energy pack's domain metrics.
results = model.run(
    config=str(model_dir / "run.json"),
    pack="energy",
)
print("status:", results.status, "| warnings:", len(results.warnings))status: ok | warnings: 0
Cash flows
The engine returns per-period signed cash flows; cashflows() gives a wide DataFrame indexed by period.
cf = results.cashflows()
print('shape:', cf.shape)
cf.head()shape: (300, 18)
         account.asset.microgrid.balance  domain.energy.cfads  \
period
2026-01                     1.596537e+06         30166.666667
2026-02                     1.593057e+06         30166.666667
2026-03                     1.589559e+06         30166.666667
2026-04                     1.586044e+06         30166.666667
2026-05                     1.582512e+06         30166.666667

         domain.energy.debt_service_periodic  domain.energy.dscr_periodic  domain.energy.ebitda  \
period
2026-01                         11462.896936                     2.631679          30166.666667
2026-02                         11462.896936                     2.631679          30166.666667
2026-03                         11462.896936                     2.631679          30166.666667
2026-04                         11462.896936                     2.631679          30166.666667
2026-05                         11462.896936                     2.631679          30166.666667

         domain.energy.opex  domain.energy.revenue  entity.asset.microgrid.net_cash_flow  \
period
2026-01         5833.333333                36000.0                         -2.381296e+06
2026-02         5833.333333                36000.0                          1.870377e+04
2026-03         5833.333333                36000.0                          1.870377e+04
2026-04         5833.333333                36000.0                          1.870377e+04
2026-05         5833.333333                36000.0                          1.870377e+04

         model.net_cash_flow  stream.energy.capacity.revenue  stream.energy.capex.outlay  \
period
2026-01        -2.381296e+06                          5000.0                  -2400000.0
2026-02         1.870377e+04                          5000.0                         0.0
2026-03         1.870377e+04                          5000.0                         0.0
2026-04         1.870377e+04                          5000.0                         0.0
2026-05         1.870377e+04                          5000.0                         0.0

         stream.energy.debt.interest  stream.energy.debt.principal  stream.energy.debt.proceeds  \
period
2026-01                 -8000.000000                  -3462.896936                          0.0
2026-02                 -7982.685515                  -3480.211420                          0.0
2026-03                 -7965.284458                  -3497.612477                          0.0
2026-04                 -7947.796396                  -3515.100540                          0.0
2026-05                 -7930.220893                  -3532.676043                          0.0

         stream.energy.itc.credit  stream.energy.om.expense  stream.energy.ppa.revenue  \
period
2026-01                       0.0              -5833.333333                    29750.0
2026-02                       0.0              -5833.333333                    29750.0
2026-03                       0.0              -5833.333333                    29750.0
2026-04                       0.0              -5833.333333                    29750.0
2026-05                       0.0              -5833.333333                    29750.0

         stream.energy.storage.margin
period
2026-01                        1250.0
2026-02                        1250.0
2026-03                        1250.0
2026-04                        1250.0
2026-05                        1250.0
# Requires the [viz] extra (pip install cfdl-sdk[viz]).
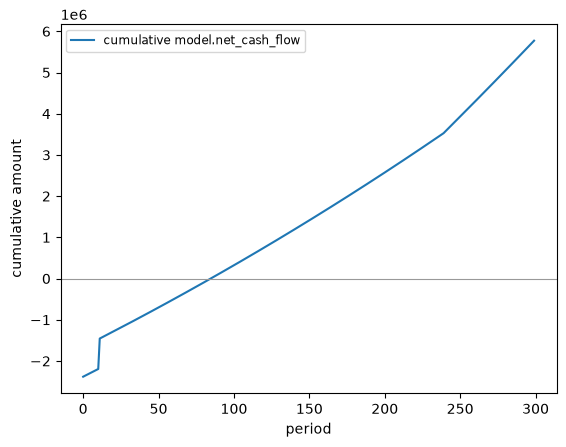
results.plot.cumulative()<Axes: xlabel='period', ylabel='cumulative amount'>
Metrics
Core metrics (NPV/IRR/MOIC/...) plus the pack's domain metrics, with their source labeled.
results.metrics_frame() metric value currency source
0 domain.energy.debt_service 2.751095e+06 USD domain:energy
1 domain.energy.dscr 3.708691e+00 domain:energy
2 domain.energy.ebitda 1.020296e+07 USD domain:energy
3 domain.energy.opex 2.391043e+06 USD domain:energy
4 domain.energy.revenue 1.259400e+07 USD domain:energy
5 domain.energy.tax_benefits 7.200000e+05 USD domain:energy
6 entity.asset.microgrid.total 5.771866e+06 USD core
7 model.irr 1.468450e-01 core
8 model.moic 3.423834e+00 core
9 model.npv 1.220669e+06 USD core
10 model.payback_periods 8.500000e+01 core
11 model.payback_years 7.166667e+00 core
12 model.total 5.771866e+06 USD core
13 model.wal_years 1.299224e+01 core
14 run.annual_discount_rate 8.000000e-02 core
15 run.periods_per_year 1.200000e+01 core
16 stream.energy.capacity.revenue.total 1.500000e+06 USD core
17 stream.energy.capex.outlay.total -2.400000e+06 USD core
18 stream.energy.debt.interest.total -1.151095e+06 USD core
19 stream.energy.debt.principal.total -1.600000e+06 USD core
20 stream.energy.debt.proceeds.total 0.000000e+00 USD core
21 stream.energy.itc.credit.total 7.200000e+05 USD core
22 stream.energy.om.expense.total -2.391043e+06 USD core
23 stream.energy.ppa.revenue.total 1.071900e+07 USD core
24 stream.energy.storage.margin.total 3.750000e+05 USD core
What-if
Re-run at a higher discount rate and compare NPV.
base = results.metrics()["model.npv"]
stressed = model.run(config={"deterministic": {"annual_discount_rate": 0.10}}, pack="energy")
print(f"NPV @ base: {base:,.0f}")
print(f"NPV @ 10%: {stressed.metrics()['model.npv']:,.0f}")NPV @ base: 1,220,669
NPV @ 10%: 737,280
Extended analysis — verify, decompose, cover
The same discipline an agent uses: don't trust a series, interrogate it.
# Verify the degradation convention: annual PPA revenue should grow at a constant
# escalation-net-of-degradation rate. pandas makes the check one line.
ppa_year = cf["stream.energy.ppa.revenue"].groupby(cf.index.year).sum()
ppa_year.pct_change().dropna().round(4).unique()array([0.0149])
A constant ~1.49% — exactly (1 + 2% escalation) x (1 - 0.5% degradation) - 1.
The engine's convention, recovered from the output.
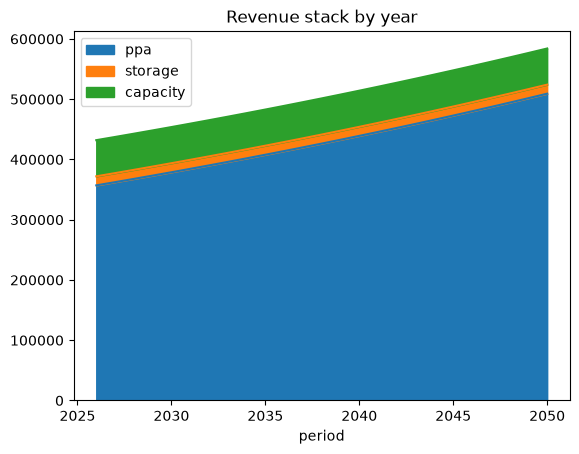
# Revenue decomposition: contracted PPA vs storage arbitrage vs capacity payments.
rev = cf[["stream.energy.ppa.revenue", "stream.energy.storage.margin", "stream.energy.capacity.revenue"]]
rev.groupby(cf.index.year).sum().rename(columns=lambda c: c.split(".")[2]).plot.area(title="Revenue stack by year")<Axes: title={'center': 'Revenue stack by year'}, xlabel='period'>
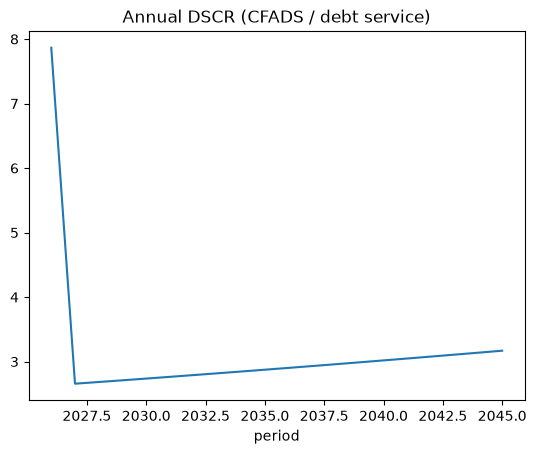
# Coverage: CFADS against debt service, annually, over the debt's life.
annual = cf[["domain.energy.cfads", "domain.energy.debt_service_periodic"]].groupby(cf.index.year).sum()
live = annual[annual["domain.energy.debt_service_periodic"] > 0]
(live["domain.energy.cfads"] / live["domain.energy.debt_service_periodic"]).plot(title="Annual DSCR (CFADS / debt service)")<Axes: title={'center': 'Annual DSCR (CFADS / debt service)'}, xlabel='period'>
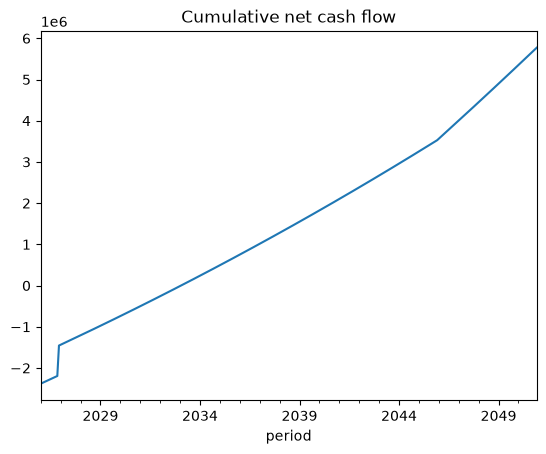
# Equity payback, from the cumulative net line and the engine's own metric.
cum = cf["model.net_cash_flow"].cumsum()
print("first cumulative-positive month:", cum[cum > 0].index.min(),
      "| model.payback_years:", results.metrics()["model.payback_years"])
cum.plot(title="Cumulative net cash flow")first cumulative-positive month: 2033-02 | model.payback_years: 7.166667
<Axes: title={'center': 'Cumulative net cash flow'}, xlabel='period'>